BREAK EVEN
TABLE OF CONTENTS
- Introduction 1
- Monthly Break-Even Volume 1
- Table 1 – Lowering Your Prices 4
- Table 2 – Raising Your Prices 5
BREAK EVEN
Introduction
If you earn a salary you know how much cash you have to spend for the coming month. If you didn’t have that salary would you know how much cash you’d need to survive?
That’s the objective of calculating your break-even sales. By knowing what your break-even point is, you have another important tool to effectively manage your business and make more profit. This is a highly underrated tool and is simple to calculate.
Monthly Break-Even Volume
Do you know the volume of business your company must achieve each month to make money? If so, you know your monthly break-even volume. If you know what this monthly sales volume should be, the chances are much greater that you will sell this volume every month. As a result, you will make more money. Ever notice the intensity in sports when the score is close and it’s near the end of the match? The energy level increases for both sides.
The sales volume at which you start making a profit is called the break-even volume. Successful companies know their monthly break-even volume. Sadly, many contractors have no idea what amount of sales they need to make each month to cover their costs. Many of those who do know, think in terms of annual break-even volume. This implies that a contractor must resign himself to some months of operating at a loss. This is unwise and unrealistic. It is advised to use a monthly break-even volume.
Your company, like your family, pays most overhead expenses monthly. Items like rent, heat, hydro, telephone, truck maintenance, advertising, etc., are generally billed and paid every month. Some costs are actually paid in full once a year. For example, your annual auto insurance might be paid on the first of January, but you should “amortize” it over the full 12 months. Don’t confuse profit with cash flow. (Refer to bulletins 17 and 18).
Once a contractor gears up to do a certain volume, his overhead expenses remain relatively fixed. Within reasonable limits, they remain constant month after month, despite the volume of business being done. If it costs relatively the same amount every month just to operate the business, then it makes sense to try to cover this overhead every month to make money every month.
As contractors we do have some variable overhead, but this is generally miniscule in relation to our total overhead. For example, fuel costs are variable. If you had no work you would park your vehicles and use no fuel. In reality this is not going to happen. If you review your history you will find that your fuel consumption from one year to another is fairly constant in relation to your sales.
Break-even volume is not an exact science. Figuring an approximate break-even volume for your company is straightforward and will provide some realistic targets to aim for.
Every time you invoice a customer you are recovering the direct cost of the work you completed; the rest of the invoice recovers a portion of your overhead and profit. If you invoice someone for $100 and the direct, out-of-pocket cost of doing that work was $75 (for labour and materials), then you have made a contribution of $25 to cover overhead and profit. That means that 25% of every sales dollar will contribute towards overhead and profit.
If you want to break even and cover your overhead, then the full 25% will be used for that purpose. When projecting your future monthly break-even sales, use a realistic gross profit (marginal contribution) percent and a realistic level of overhead. You can easily forecast “what‑if” scenarios.
For example, if you lower your prices by 5% your gross profit drops to 20% and this becomes the dividing figure; alternatively, if you increase your prices by 5% your gross profit percent increases to 30%, and this becomes the dividing figure.
Step 1
Start with your company’s overhead expenses. You can take these from your current operating statement, from your budget or from last year’s statement, adjusting for changes that are occurring this year. If you are projecting this year’s overhead at $144,000, your monthly overhead is $144,000/12 = $12,000 per month.
Step 2
Take your company’s average gross margin (profit); let’s assume 25%. Obviously, some jobs earned more than this figure and some earned less, but we will use this as the average.
Approximate monthly break-even volume:
= Average monthly overhead/average gross margin
= $12,000/.25
= $48,000
That’s it – only two steps!
Take 5% off your selling price, and you drop your gross margin to 20%. You will have lower prices and require higher volume to break even.
Approximate monthly break-even volume:
= $12,000/.20
= $60,000 per month
In this instance, a 5% drop in selling price requires a 25% increase in sales volume to cover the same overhead.
Increase your selling price by 5%, and you increase your gross margin to 30%. You will have higher prices and need lower volume to break even.
Approximate monthly break-even volume:
= $12,000/.30
= $40,000 per month
In this instance, a 5% increase in selling price allows a 20% decrease in volume to cover the same overhead.
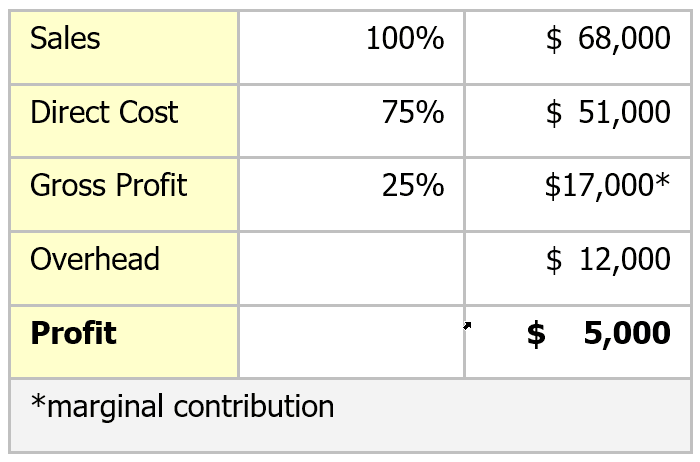
What about profit? Repeat this exercise, but add the required profit to the overhead. With a 25% gross profit and a desired profit of $5,000, add the profit to the overhead ($5,000 + $12,000) for a total of $17,000, divided by 25% = $68,000. Your marginal contribution is 25% of sales.
Proof

Note
For most contractors, overhead is fixed for periods of at least six months. The amount of variable overhead is relatively small. If you do have variable overhead, reduce your marginal contribution by the amount of variable overhead so that you are only recovering your fixed overhead. In the above example, where the contribution is 25% in relation to overhead, this would change if variable overhead existed. If variable overhead was 3% of sales we would have a marginal contribution of 22% rather than 25%.
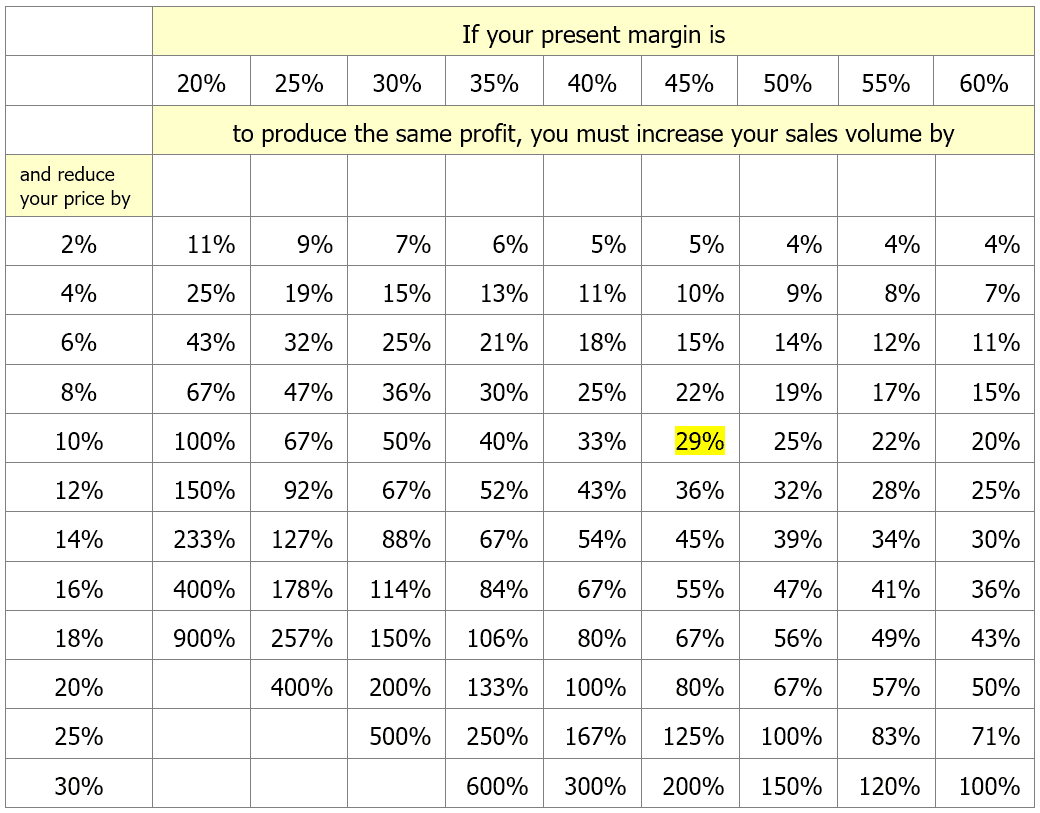
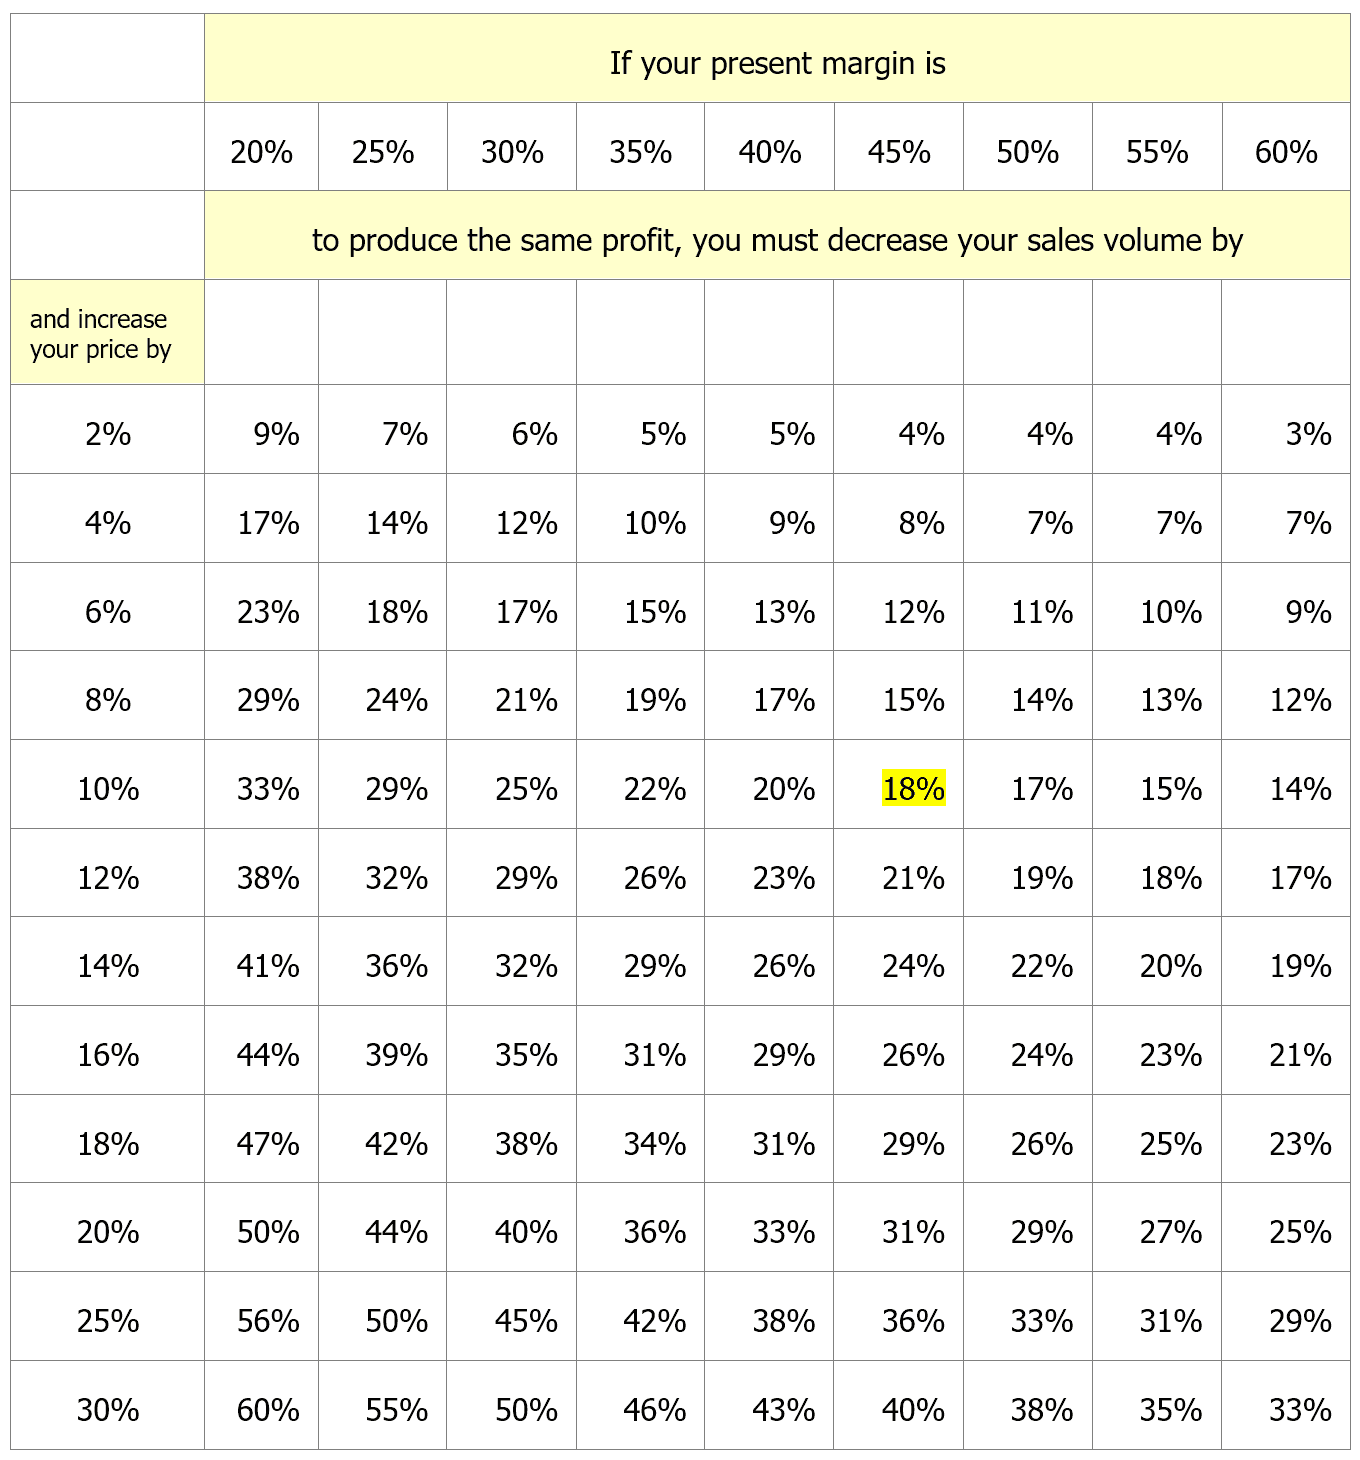
The following tables show how your volume and profits are sensitive to price changes.
Table 1 – Lowering Your Prices
This table indicates the increase in sales that is required to compensate for a price discounting policy. For example, if gross margin is 30% and you reduce price by 10%, sales volume needs to increase by 50% to maintain your initial profit. Rarely has such a strategy worked in the past, and it’s unlikely that it will work in the future.

Table 2 – Raising Your Prices
On the other hand, this table shows the amount your sales would have to decrease, following a price increase and before your gross profit is reduced below its previous level. For example, if gross margin is 30% and you increase selling price by 10%, you would need to experience a 25% reduction in sales volume before profit is reduced to its previous level. You would have to lose one out of every four customers.

Your Plan of Action
- Determine your realistic break-even sales; add your required profit margin and do it.
